Spark Metrics is useful if we debug our Spark applications and integetrating with Prometheus and Grafana is a common way to show it.
Background
When we upgrade to Spark 3.0 from 2.4, we found it change the default behevior to compare the date. So it introduce a issue that Spark will load all Hive partitions and do filter in memory instead of doing filter when loading Hive Partitions. Check this two issues SPARK-27638 and SPARK-40610, you can learn more.
When I debug this issue, I found there is a Spark Metrics called partitionsFetched.count is used to monitor the number of Spark load Hive Partitions. If I can compare this metric between Spark 3 job and Spark 2 job, I can find the root cause early.
This why this document come out.
Preparation
1. Spark Metrics
Go to offical websit to learn more: https://spark.apache.org/docs/latest/monitoring.html#metrics
2. Prometheus
Offical websit: https://prometheus.io/ Simply introudction: From metrics to insight, Power your metrics and alerting with the leading open-source monitoring solution.
3. Grafana
offical websit: https://grafana.com/ Simply introudction: Operational dashboards for your data here, there, or anywhere
Let’s Go
Note: this doc only be test in local env instead of prod env.
1. Spark side
Enable Prometheus Metrics in Spark job
In Spark source code, there is a template configuration file conf/metrics.properties.template. Copy it as metrics.properties. And uncomment the configurations related Prometheus:
# Example configuration for PrometheusServlet
*.sink.prometheusServlet.class=org.apache.spark.metrics.sink.PrometheusServlet
*.sink.prometheusServlet.path=/metrics/prometheus
#master.sink.prometheusServlet.path=/metrics/master/prometheus
#applications.sink.prometheusServlet.path=/metrics/applications/prometheus
Run a Spark Job
You can build the Spark Source code in your local machine, detail can follow here.
After the Spark source code build successfuly, we can run its exmaples. Let’s choose SparkSQLExample.scala as an example.
But we need do two modifications about the code. One is add configuration to set Metics configuration file. Another is adding while(true) {} to keep the spark session running so that we can monitor it in Prometheus. The main function looks like:
  def main(args: Array[String]): Unit = {
    // $example on:init_session$
    val spark = SparkSession
      .builder()
      .appName("Spark SQL basic example")
      .config("spark.master", "local[*]")
      // set spark.metrics.conf
      .config("spark.metrics.conf", "/the/path/of/metrics.properties")
      .config("spark.some.config.option", "some-value")
      .getOrCreate()
    // $example off:init_session$

    runBasicDataFrameExample(spark)
    runDatasetCreationExample(spark)
    runInferSchemaExample(spark)
    runProgrammaticSchemaExample(spark)

    // we don't want to close the spark session
    while(true) {}
    spark.stop()
  }
When the Spark job is running, you can visit http://localhost:4040/metrics/prometheus/ in the browser. You can see some metrics like:
......
metrics_local_1684119990704_driver_BlockManager_disk_diskSpaceUsed_MB_Number{type="gauges"} 0
metrics_local_1684119990704_driver_BlockManager_disk_diskSpaceUsed_MB_Value{type="gauges"} 0
metrics_local_1684119990704_driver_BlockManager_memory_maxMem_MB_Number{type="gauges"} 8558
metrics_local_1684119990704_driver_BlockManager_memory_maxMem_MB_Value{type="gauges"} 8558
metrics_local_1684119990704_driver_BlockManager_memory_maxOffHeapMem_MB_Number{type="gauges"} 0
metrics_local_1684119990704_driver_BlockManager_memory_maxOffHeapMem_MB_Value{type="gauges"} 0
metrics_local_1684119990704_driver_BlockManager_memory_maxOnHeapMem_MB_Number{type="gauges"} 8558
metrics_local_1684119990704_driver_BlockManager_memory_maxOnHeapMem_MB_Value{type="gauges"} 8558
metrics_local_1684119990704_driver_BlockManager_memory_memUsed_MB_Number{type="gauges"} 0
metrics_local_1684119990704_driver_BlockManager_memory_memUsed_MB_Value{type="gauges"} 0
......
2. Setup Prometheus
Prometheus
Create prometheus.yml with:
global:
  scrape_interval: 3s

scrape_configs:
  - job_name: 'spark-driver'
    # default metrics_path is `/metrics`, need change it to match the config in Spark metrics.properties
    metrics_path: /metrics/prometheus
    static_configs:
      # For convenience, I will use docker to run it. If you want to run them without docker, please replace `host.docker.internal` with the real IP address
      - targets: ['host.docker.internal:4040']
  - job_name: 'prometheus-status'
    static_configs:
      - targets: ['localhost:9090']
Learn more from here.
3. Start Prometheus and Grafana docker
Create docker-compose.yml:
version: "3"
services:
  prometheus:
    image: prom/prometheus
    container_name: prometheus
    volumes:
      - ./prometheus.yml:/etc/prometheus/prometheus.yml
    ports:
      - "9090:9090"
  grafana:
    image: grafana/grafana
    container_name: grafana
    ports:
      - 3000:3000
    volumes:
      - grafana_data:/var/lib/grafana

volumes:
  grafana_data:
In the same folder, start the containers:
$ ls
docker-compose.yml prometheus.yml

$ docker-compose up -d

[+] Running 4/4
 ⠿ Network dockers_default        Created                                          0.0s
 ⠿ Volume "dockers_grafana_data"  Created                                          0.0s
 ⠿ Container prometheus           Started                                          0.3s
 ⠿ Container grafana              Started                                          0.3s
4. Valid result
check prometheus
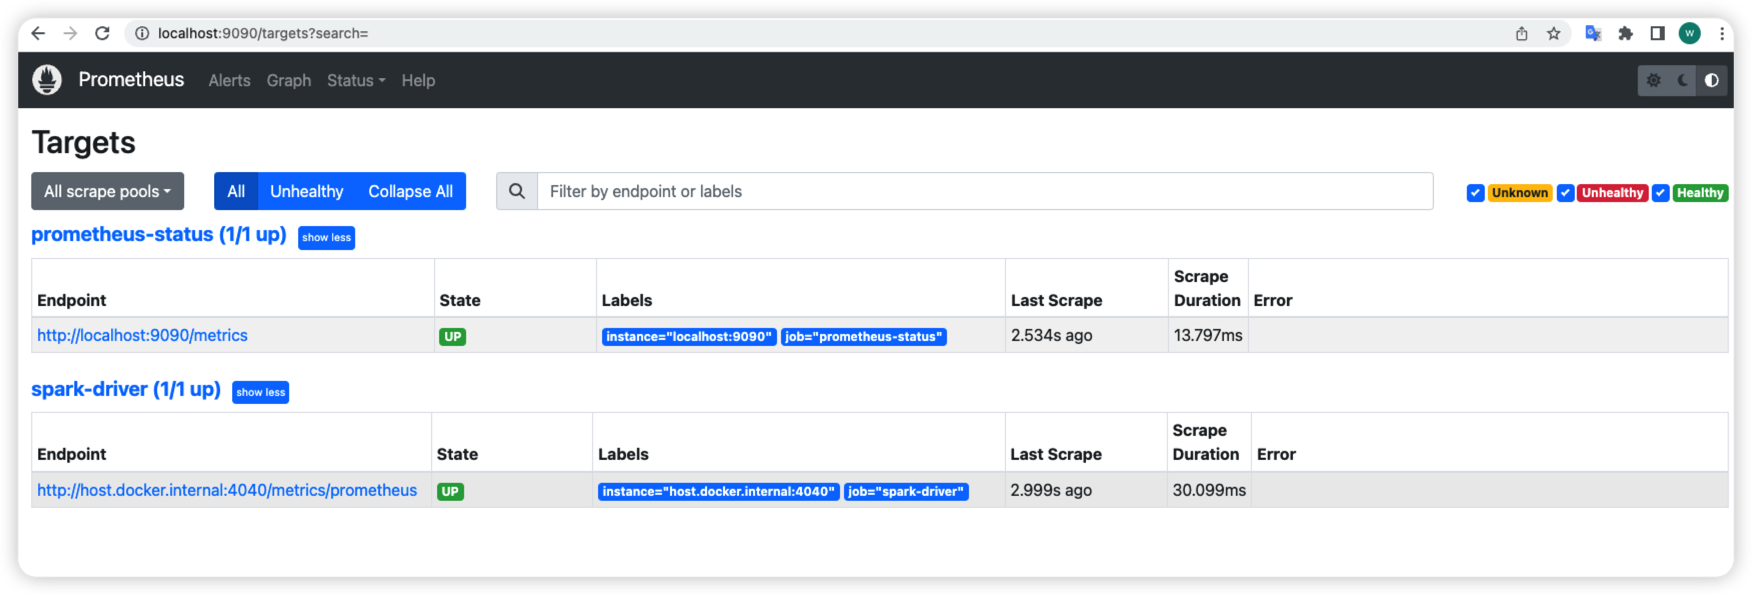
Go http://localhost:9090/targets?search= to check if Spark target up.
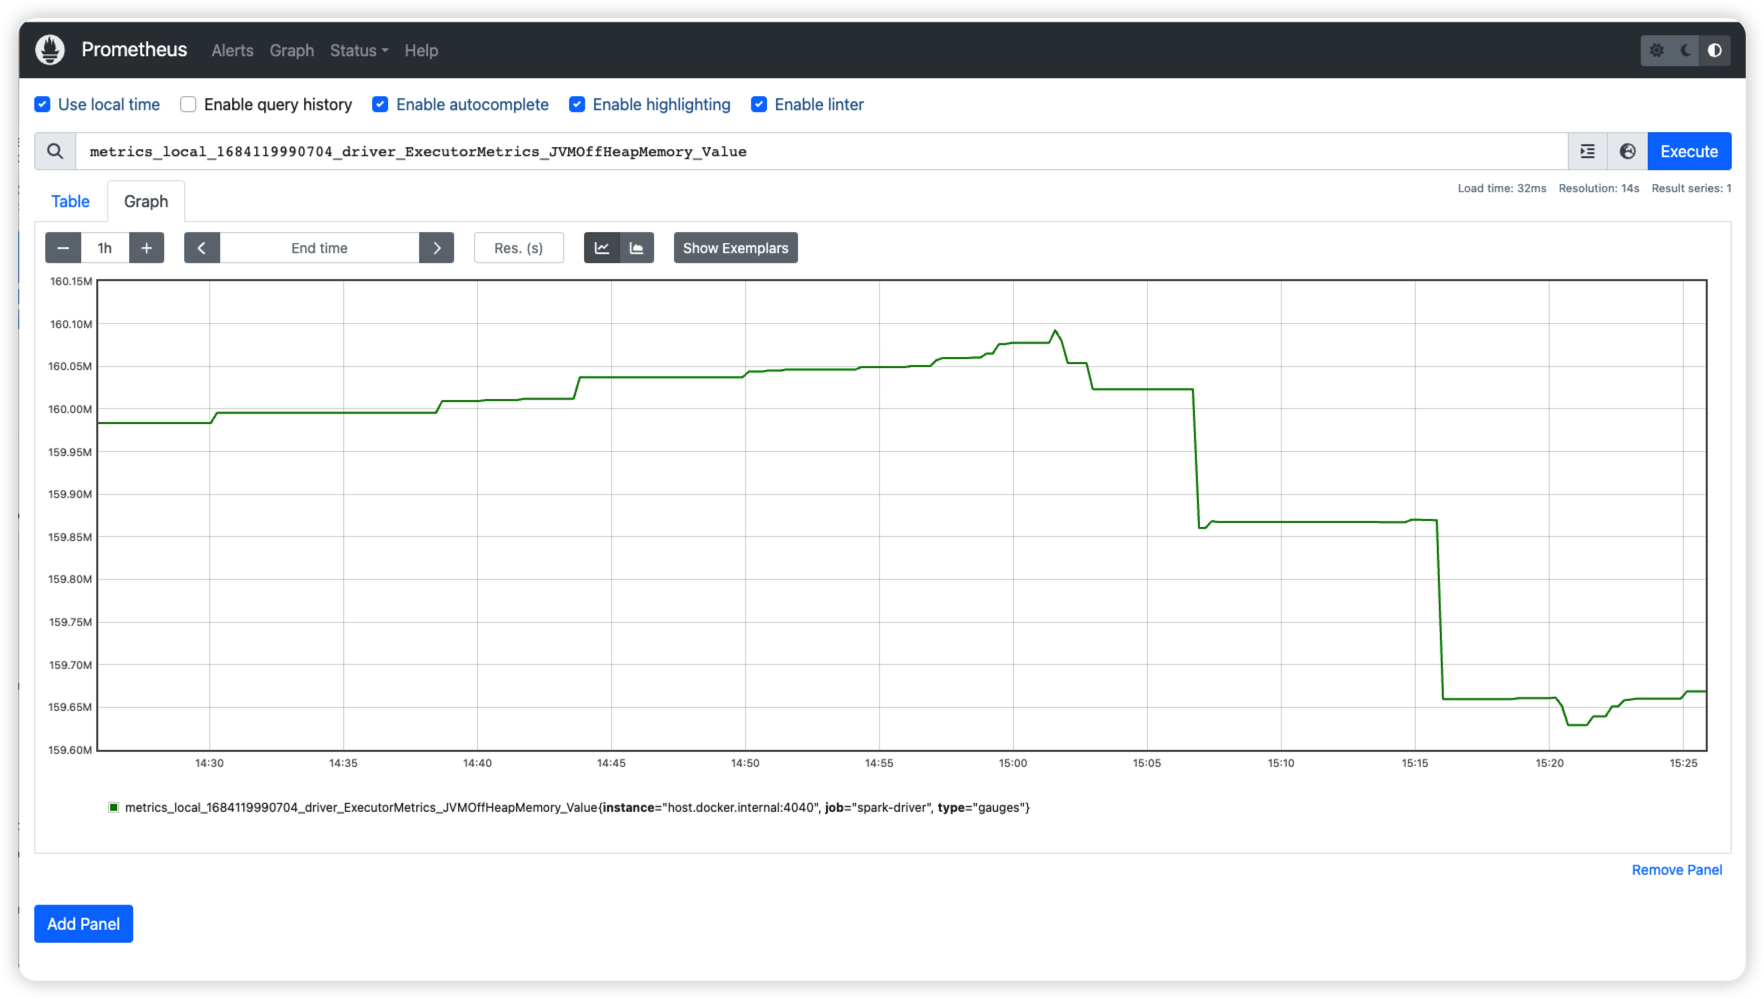
Go http://localhost:9090/graph?g0.expr=&g0.tab=1&g0.stacked=0&g0.show_exemplars=0&g0.range_input=1h to fetch one metric to see its values. Search the metric name in the Expression text box you want to check then click Execute. Then choose the Graph tab. It will show like below:
check Grafana
Open http://localhost:3000/ in browser. The default username/password is admin/admin.
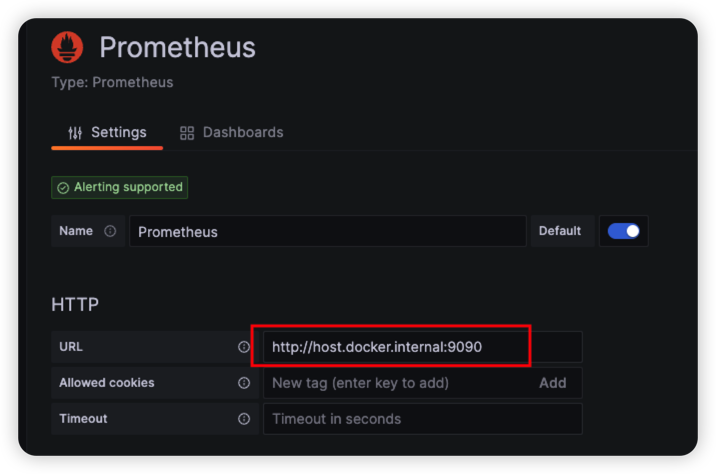
Firstly, we need create a Prometheus data source in Grafana. You can follow this Grafana offical document to set up it.
Here only one thing need to care about is that we run them in Docker so you need set the URL as http://host.docker.internal:9090 like:
When adding the data source, we can create the Dashboard to display the metrics.
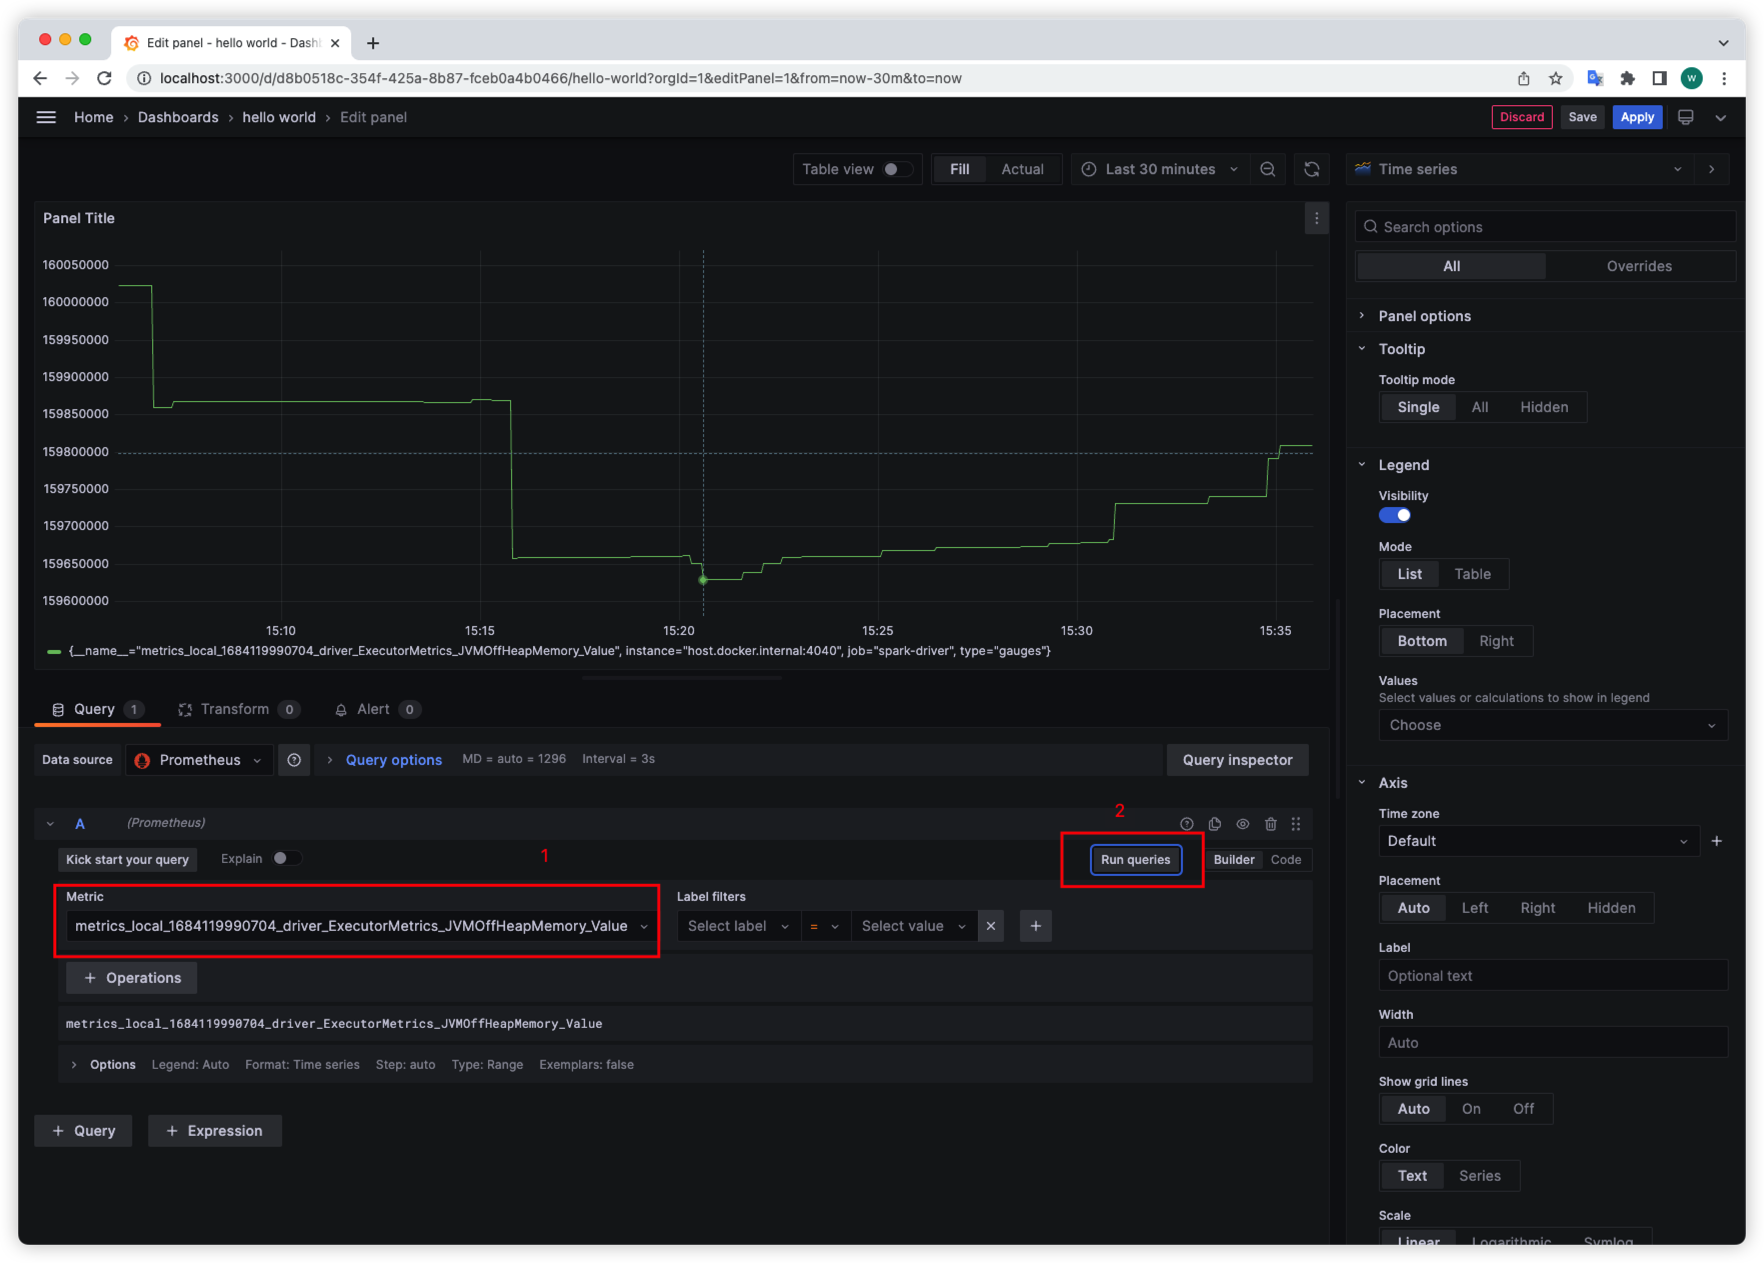
After everything set up as you wish, You can click Save in the upper right corner.
Further
- Learn more use case about Grafana
- Try to deploy the dockers to Prod VM.